

Introduction
In today’s fast-paced business environment, data-driven decisions are crucial for success. Businesses increasingly rely on accurate insights on data to make informed decisions, to understand trends, optimise strategies, and stay competitive. Python, known for its simplicity and powerful scientific capabilities, has become a widely adopted tool for analysing data through data science techniques, making it accessible to professionals across various domains and industries. One of the easiest ways to utilise Python for data analysis is through the Jupyter Notebook tool—a user-friendly, interactive platform that simplifies data exploration, visualisation, and analysis—allowing businesses to gain valuable insights effortlessly.
With Business Analysts evolving into data-driven professionals, they increasingly take on roles similar to Data Scientists, where they leverage Python to uncover hidden patterns and meaningful insights from vast datasets. Businesses are also expecting Business Analysts to have expertise similar to Data Scientists, if not fully Data Scientists. This blog will guide aspiring Business Analysts in effectively using Python for Data Science using Jupyter Notebook, helping them analyse complex data effortlessly and make informed business decisions with confidence and efficiency.
Why Data Science Induced in Business Analysis?
Business Analysts seek various types of data, including customer demographics, purchasing behaviours, market trends, financial performance, and operational processes. These insights help businesses identify patterns, forecast demand, optimise strategies, and improve decision-making. By analysing customer preferences, businesses can enhance product offerings and tailor marketing efforts for better engagement. Operational data aids in enhancing productivity, improving efficiency, and reducing costs, while financial insights ensure better investment decisions.
Competitor analysis helps businesses position themselves effectively in the market. By leveraging data-driven insights, companies anticipate future trends and gain a competitive edge in the market, enabling informed decisions that lead to strategic planning, innovation, increased profitability, and sustainable growth in an ever-evolving business landscape.
Although Python for Data Science is mainly used for Data Analytics—examining raw data to identify patterns, draw conclusions, and make informed decisions—I have intentionally rather used the term Data Analysis throughout this blog. Business Analysts, though skilled in handling data, are not full-fledged Data Scientists and have broader responsibilities beyond deep data analytics. This distinction does not undermine the expertise of Data Scientists, as their role remains indispensable. However, Business Analysts can still perform essential data analysis tasks, enabling them to uncover valuable insights and hidden patterns crucial for informed business decisions. Their ability to leverage Python enhances their analytical efficiency while complementing traditional data science practices.
Why Python for Data Science?
Python’s worldwide acceptability in both the scientific community and industry stems from its simplicity, versatility, and extensive libraries, making it a powerful tool for research, automation, data science, and complex problem-solving. Some of its advantages are explained as follows:
- Open-source and widely adopted: Python is free to use, making it accessible for individuals and enterprises alike. Its extensive community ensures constant development, updates, and scalability, allowing businesses to rely on a stable and well-supported programming language for data science applications across industries.
- Extensive reliable libraries: Python’s vast ecosystem of libraries like Pandas, NumPy, Matplotlib, and Scikit-learn enables efficient data handling, statistical analysis, visualisation, and machine learning. These powerful tools simplify complex calculations, automate tasks, and enhance predictive modelling capabilities, allowing Business Analysts and Data Scientists to extract meaningful insights with ease.
- Easy integration with databases and APIs: Python supports seamless connectivity with SQL, NoSQL, and cloud-based databases, making data retrieval and storage effortless. It also integrates well with APIs, enabling businesses to automate data processing, extract real-time insights, and optimise decision-making through dynamic and interconnected systems.
- User-friendly syntax and rich documentation support: Python’s simple, readable syntax makes coding intuitive, reducing the learning curve for beginners and professionals alike. Comprehensive documentation, tutorials, and an active global community provide valuable guidance, ensuring developers can troubleshoot issues and implement data science solutions effectively and efficiently.
Jupyter Notebook: The Perfect Playground for Data Analysis
Despite the presence of many powerful data analysis tools like Power BI, Tableau, Looker, etc., Jupyter Notebook remains the perfect playground for data analysis due to its flexibility in simple coding, open-source nature, seamless integration with scientific Python libraries, and ability to perform deep exploratory analysis and machine learning within an interactive environment. On top of these unique features, Jupyter Notebook is an open-source tool and completely free to use. It is widely adopted by the data science and academic communities, offering flexibility in coding, visualisation, and exploratory analysis without any licensing costs. Some of its advantages are explained as follows:
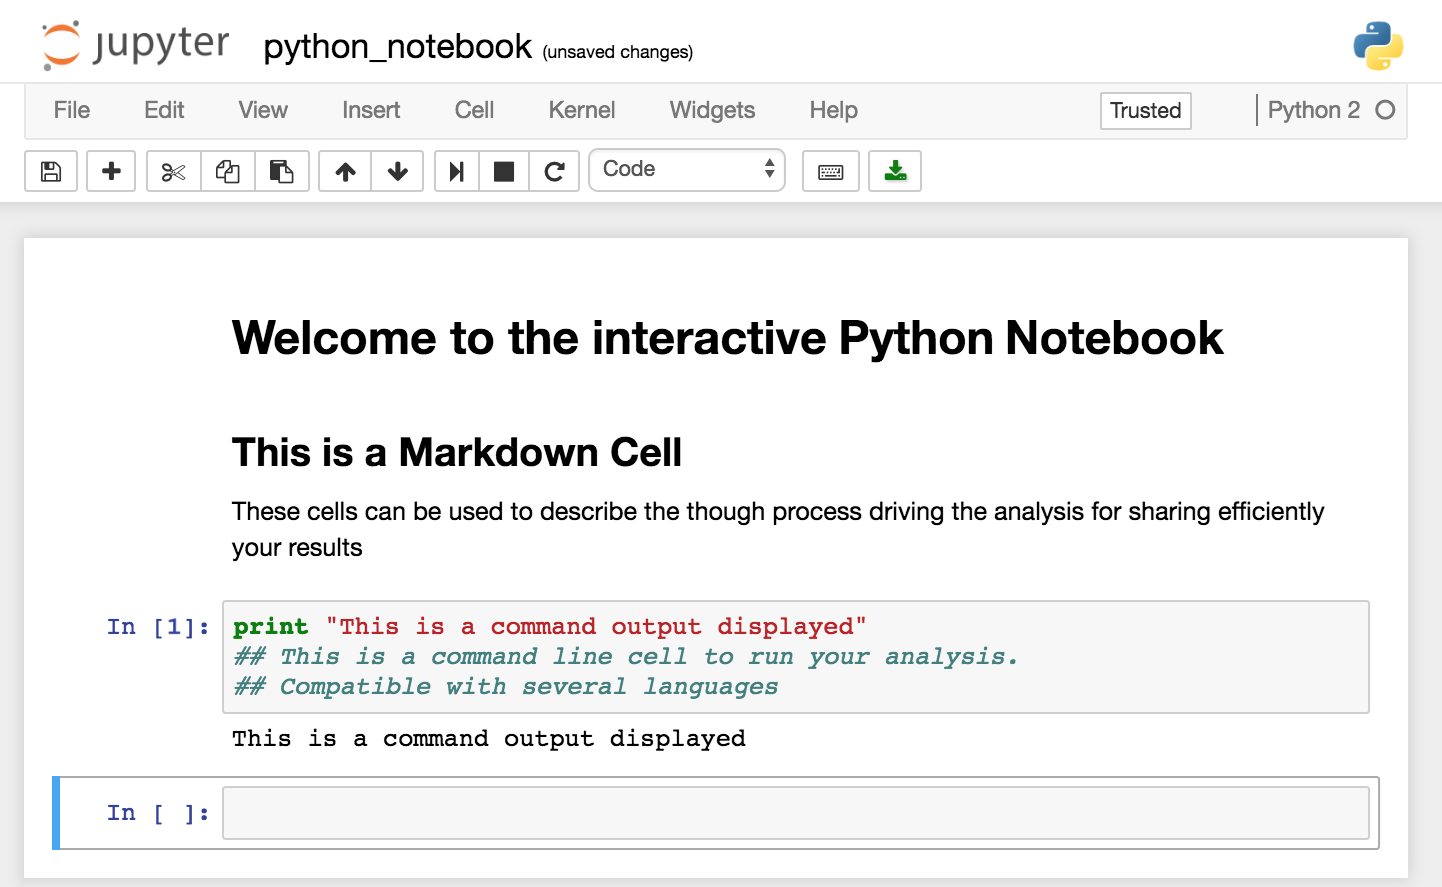
- Interactive code execution and visualisation: Jupyter Notebook allows users to write and execute code step by step, making debugging and experimentation seamless. Its built-in support for data visualisation libraries like Matplotlib and Seaborn helps generate insightful graphs and charts, making data interpretation easier for business analysts and data scientists.
- Markdown support for documentation within notebooks: Jupyter Notebook’s markdown feature lets users write detailed explanations alongside code, ensuring clarity in analysis. This helps in documenting workflows, making it easy to understand processes, share reports, and maintain well-structured records for future reference or collaboration within research and business teams.
- Easy data exploration and manipulation: With libraries like Pandas and NumPy, Jupyter Notebook simplifies data loading, cleaning, transformation, and visualisation. Analysts can quickly explore datasets using built-in functions, filter values, perform computations, and gain valuable insights, streamlining decision-making processes across industries and business applications.
- Ideal for sharing analysis with teams and stakeholders: Jupyter notebooks can be exported into different formats, including HTML, PDF, and interactive notebooks, making it effortless to present findings to colleagues, managers, or clients. With platforms like GitHub or cloud-based collaboration tools, data-driven insights can be shared and discussed efficiently.
Step-by-Step Guide to Using Python for Data Analysis
The following sections describes how Business Analysts can proceed step-by-step using the tool Jupyter Notebook with Python to analyse data. A basic understanding of the Python language that we learned during school or colleges, is enough to carry out these steps. Actual hands-on demonstration is shown in my next blog. Here I have covered only the logical steps and concepts:
1. Data Acquisition and Loading
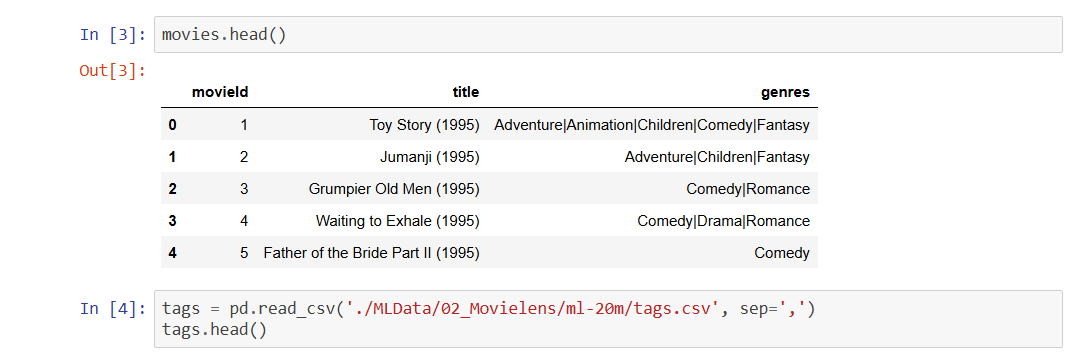
- Accessing the data: Any data analysis starts with first accessing the data. In the Jupyter Notebook tool, we can use a Python library called Pandas (Panel Data Analysis), to import datasets from CSV, Excel, APIs, or databases. Pandas makes data import seamless, allowing the analysts to pull structured datasets from various sources for analysis.
- Data Review: Once the data is fetched and shown in a panel form called DataFrame (df) in the Jupyter Notebook screen, we can quickly preview the data using commands df.head() and df.describe() to understand the data structure as per the function. These functions provide an initial look at the dataset’s contents, helping analysts grasp key statistics and detect inconsistencies, if any.
2. Data Cleaning and Pre-processing
- Data Cleaning: During data review if any missing values are observed in the dataset, those can be handled using the commands df.fillna() and df.dropna(), to fill the missing values with null values or to remove such rows, respectively. Missing data can skew results, so filling or removing empty entries ensures accuracy in business insights.
- Data type conversion: If any data type needs to be converted for proper classification, say from numeric to float or integer, we can do so using the command astype(). For example, to change data type of ‘col1’ to float, we write df[‘col1’] = df[‘col1’].astype(float). Similarly, to change data type of ‘col2’ to integer, we write df[‘col2’] = df[‘col2’].astype(int). It may look bit complex, but actually very simple. Converting data types ensures numerical values are correctly processed for computations, preventing errors in analysis.
- Pre-processing: Sometime we need to create new variable in new columns. For example, a new column can be created by performing a simple arithmetic operation on existing columns, like, df[‘total’] = df[‘col1’] + df[‘col2’]. Creating new variables from existing data enhances predictive modelling, making insights more relevant for strategic decision-making.
3. Exploratory Data Analysis (EDA)
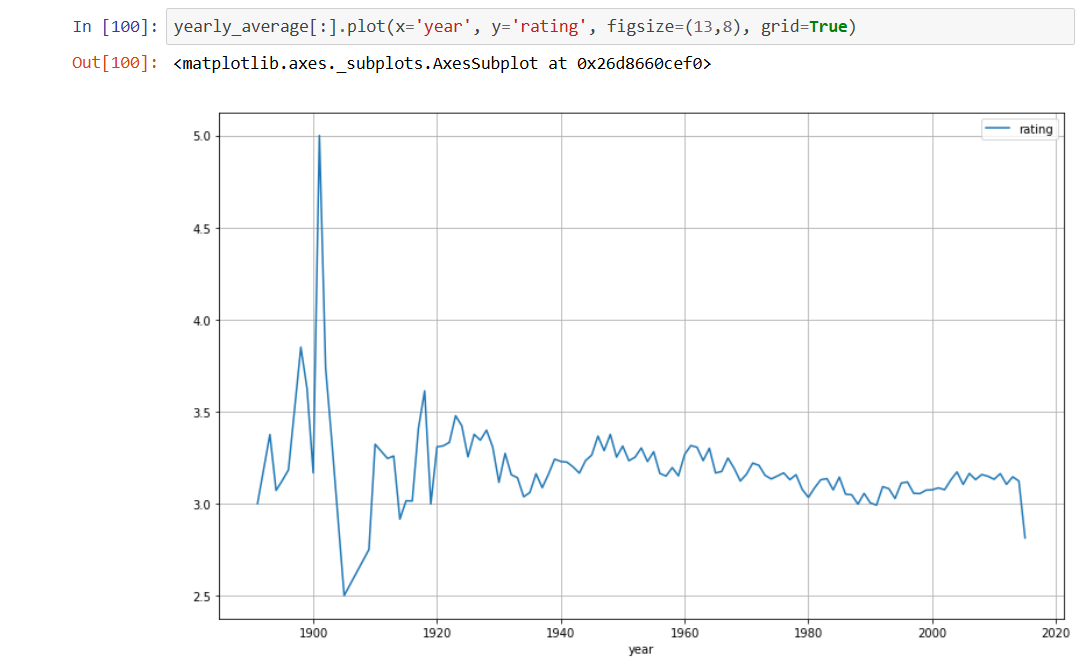
- Data visualisation: The best part in Jupyter Notebook with Python is playing with data using the Pandas and Matplotlib libraries for statistical summaries and visualizations. Pandas aids in understanding data distributions, while Matplotlib generates graphs for easy interpretation.
- Visualizing data relationships: Apart from simple data visualisations, Jupyter Notebook with Python is used for creating histograms, scatter plots, and correlation heatmaps to show relations between data entities. Visualizing data relationships helps identify trends and dependencies, guiding businesses toward informed choices.
- Identifying patterns: Jupyter Notebook with Python is a very handy tool for identifying patterns for better business insights. Recognising trends and anomalies aids in optimizing operations and predicting future outcomes for competitive advantage.
4. Applying Machine Learning Models
In simple words, machine learning algorithms are complex statistical computational techniques, like complex plots or patterns, that enable computers to learn from data and make predictions or decisions without being explicitly programmed. For example, using a Linear Regression model, the machine i.e., the computer can predict a continuous target variable based on one or more input variable, assuming both have a linear relationship. Machine learning algorithms are essentially mathematical models that adapt and improve their performance over time by processing data. These algorithms can be broadly categorized into supervised, unsupervised, and reinforcement learning approaches where user need to trains an agent to make decisions. Jupyter Notebook with Python is used to apply the machine learning algorithms on data with ease.
- Using Scikit-learn for predictive analytics: Scikit-learn is a powerful Python library for machine learning, offering a wide array of tools for various tasks, including classification, regression, clustering, and dimensionality reduction, helping businesses forecast outcomes with data-driven models.
- Training classification and regression models: Machine learning techniques help training the classification and regression models with business datasets to categorize customer behaviours and predict financial trends based on historical data.
- Assessing model accuracy and fine-tuning hyperparameters: Adjusting parameters optimizes models, ensuring they provide reliable predictions for strategic decision-making.
5. Data Visualization for Decision-Making
- Creating interactive dashboards: With advanced Python data visualization libraries like Seaborn and Plotly and using various Python frameworks, user can generate dynamic, visually appealing dashboards that communicate complex data in an accessible format.
- Communicating insights effectively through graphs and reports: Jupyter Notebook with Python graphical libraries help clear visual presentations that enhance stakeholder understanding, and improving decision-making efficiency.
- Real-time trend analysis with dynamic visualizations: Python can also be used to track live data changes that help businesses adapt quickly to market shifts and emerging opportunities.
Conclusion
Python with Jupyter Notebook is a handy tool, that streamlines data exploration, making complex analysis more accessible and efficient. Its intuitive syntax, extensive libraries, and interactive environment empower analysts to extract meaningful insights effortlessly. Businesses can leverage Python’s capabilities to drive informed decision-making, optimize strategies, and gain a competitive edge in the market. By simplifying data manipulation, visualization, and predictive analytics, Python enables analysts and decision-makers to work faster, automate tasks, and focus on deriving data intelligence. Whether used by beginners or experienced professionals, Python’s adaptability makes it an essential tool for harnessing the true potential of Data Science for business growth.
To check some of the outcomes of using Python with Jupyter Notebook, visit my next blog.