

What is Data Science?
Data Science is the interdisciplinary field that uses statistical, computational, and algorithmic techniques to extract insights and knowledge from structured and unstructured data that drives informed decision-making and problem-solving.
Data is the foundation of Data Science; without it, the entire process of analysis and insights is impossible. Data scientists rely on vast amounts of relevant data to extract meaningful insights and patterns. This data can be structured, like databases and spreadsheets, or unstructured, such as text, images, and videos. By collecting, processing, and analysing this data, data scientists can uncover trends, make predictions, and solve complex problems. Businesses leverage these insights to make informed decisions, optimise operations, and drive innovation. Without data, there is nothing to analyse, and the potential for data-driven decision-making and problem-solving is lost, highlighting its crucial role in Data Science.
How to Visualise Data?
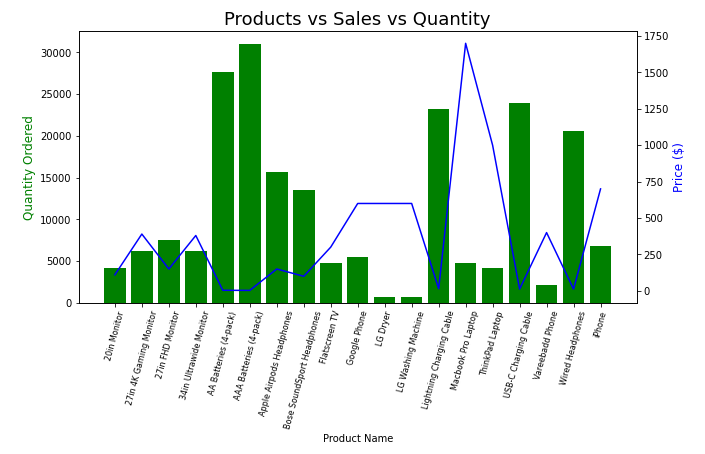
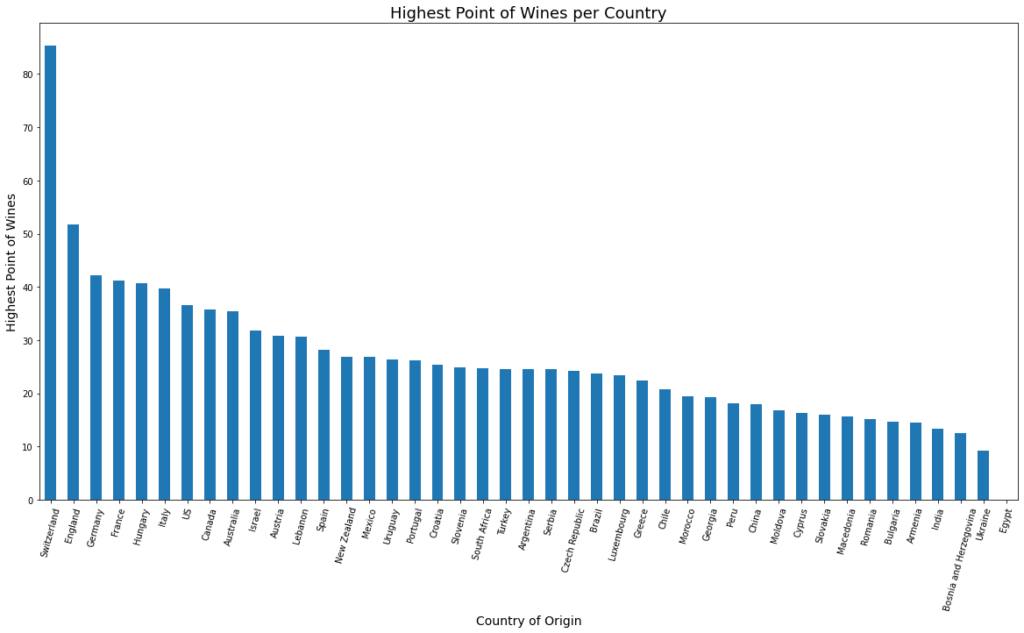
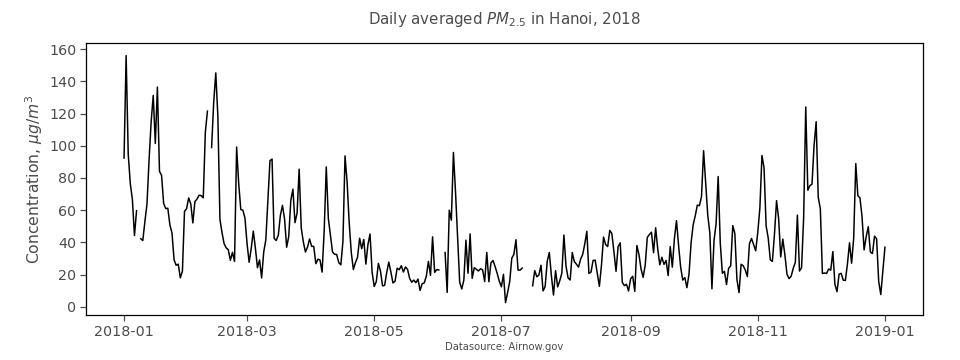
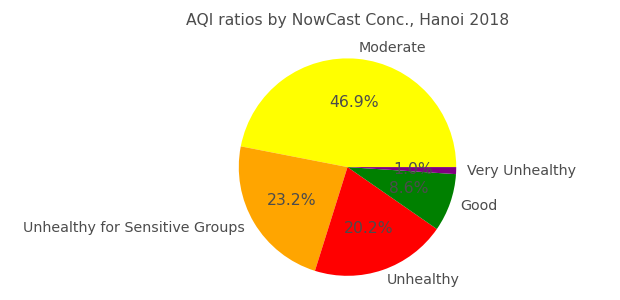
Data hides a story within it. is useless until you view the data to get insightful information. Visualising data involves using tools like Matplotlib, Seaborn, Plotly, and Tableau to create graphs, charts, and interactive plots. These tools help uncover trends, patterns, and insights from data. There is one handy tool, Jupyter Notebook, that enhances this process by integrating these visualisation libraries directly within the notebook (see image below). It allows real-time code execution and visualisation of data in a single environment, making it easy to experiment, iterate, and present results effectively. This seamless integration streamlines analysis and communication for data-driven decision-making.
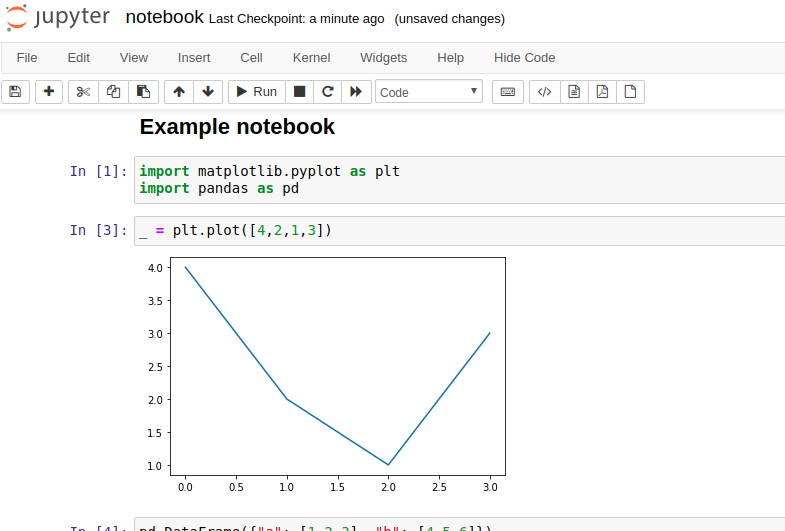
A Business Analyst can leverage Jupyter Notebook to streamline data analysis and reporting. Jupyter Notebook is an open-source, interactive web application that allows users to create and share documents containing live code, equations, visualisations, and narrative text. It’s widely used in data science, machine learning, and academic research for data analysis and visualisation. The notebook interface supports various programming languages, including Python, R, and Julia, making it a versatile tool for collaborative and reproducible data science projects. Jupyter Notebooks enhance the workflow by enabling code execution in real-time, visualising data with rich media output, and integrating detailed explanations, making complex analyses more accessible and comprehensible.
The simplest code you can use in Jupyter Notebook is Python to analyse data. By integrating live code with rich visualisations, Jupyter allows analysts to explore datasets, perform complex calculations, and create interactive charts seamlessly. This interactive environment facilitates data cleaning, transformation, and statistical analysis. Moreover, Jupyter’s narrative capabilities enable analysts to document their workflow, share insights, and collaborate with stakeholders effectively. The ability to integrate multiple programming languages and libraries within a single notebook makes it a powerful tool for developing, testing, and presenting data-driven business solutions.
Data Science and Analytics are incredibly valuable for Business Analysts. They provide tools and methodologies to extract, analyse, and interpret data to make informed business decisions. Here’s how in seven ways these tools and methodologies help:
1. Enhanced Decision-Making
Data science helps business Analysts make data-driven decisions rather than relying on intuition. Data science equips Business Analysts with tools to make more informed decisions by relying on statistical analysis, machine learning, and predictive modelling. This approach minimises the reliance on intuition and guesswork, making decisions more accurate and reliable. Analysts can forecast future trends, predict customer behaviour, and assess potential outcomes, leading to more strategic planning and effective decision-making processes that align with business goals.
2. Identifying Opportunities
By analysing large volumes of data from various sources, Business Analysts can identify trends, patterns, and anomalies that may not be apparent through traditional analysis methods. This deep dive into data can reveal new market opportunities, product improvements, exploring areas for innovation, or optimising operations. Such insights can drive strategic initiatives, optimise marketing efforts, and help the business stay ahead of competitors by capitalising on identified opportunities.
3. Performance Measurement
Analytics tools enable Business Analysts to continuously monitor and evaluate key performance indicators (KPIs) and metrics that are critical to business success. This allows businesses to monitor their performance, identify areas of improvement, and measure the effectiveness of their strategies. It helps identify areas where the business excels and is doing well and also identify areas where corrective measures are needed for doing well. By understanding performance trends over time, businesses can implement data-driven strategies to enhance efficiency, effectiveness, and overall performance, ensuring alignment with organisational objectives.
4. Customer Insights
Advanced data science techniques, such as clustering and segmentation, allow Business Analysts to gain a deeper understanding of customer behaviour, preferences, and demographics. This information is invaluable for tailoring marketing strategies, personalising customer experiences, and improving product offerings. By understanding what drives customer satisfaction and loyalty, businesses can create targeted campaigns, enhance customer service, and ultimately increase customer retention and revenue.
5. Risk Management
Predictive analytics plays a crucial role in identifying and assessing potential risks by analysing historical data and recognising patterns that may indicate future risks. This proactive approach allows businesses to develop risk mitigation strategies, prepare for various scenarios, and make informed decisions to protect assets and ensure business continuity. Effective risk management helps businesses minimise losses, avoid disruptions, and maintain a stable and secure operating environment.
6. Operational Efficiency
Data analytics can streamline business processes by identifying inefficiencies, bottlenecks, and areas where resources are being underutilised. By analysing operational data, Business Analysts can recommend changes that lead to cost savings, improved productivity, and better resource allocation. This optimisation of processes ensures that the business operates more smoothly and efficiently, ultimately leading to increased profitability and a stronger competitive position.
7. Competitive Advantage
Leveraging data science and analytics provides a competitive edge. Companies that harness the power of data can innovate faster, adapt to market changes, and make data-driven decisions more effectively. Such data-driven organisations can identify emerging trends, respond quickly to market demands, and stay ahead of competitors. This agility and foresight are critical in today’s fast-paced business environment, where the ability to anticipate and respond to changes can make the difference between success and failure.
Data Science and Analytics empower Business Analysts to transform data into actionable insights, leading to better outcomes and business growth. If you want to delve deeper into any of these areas, let me know in the comments section below!